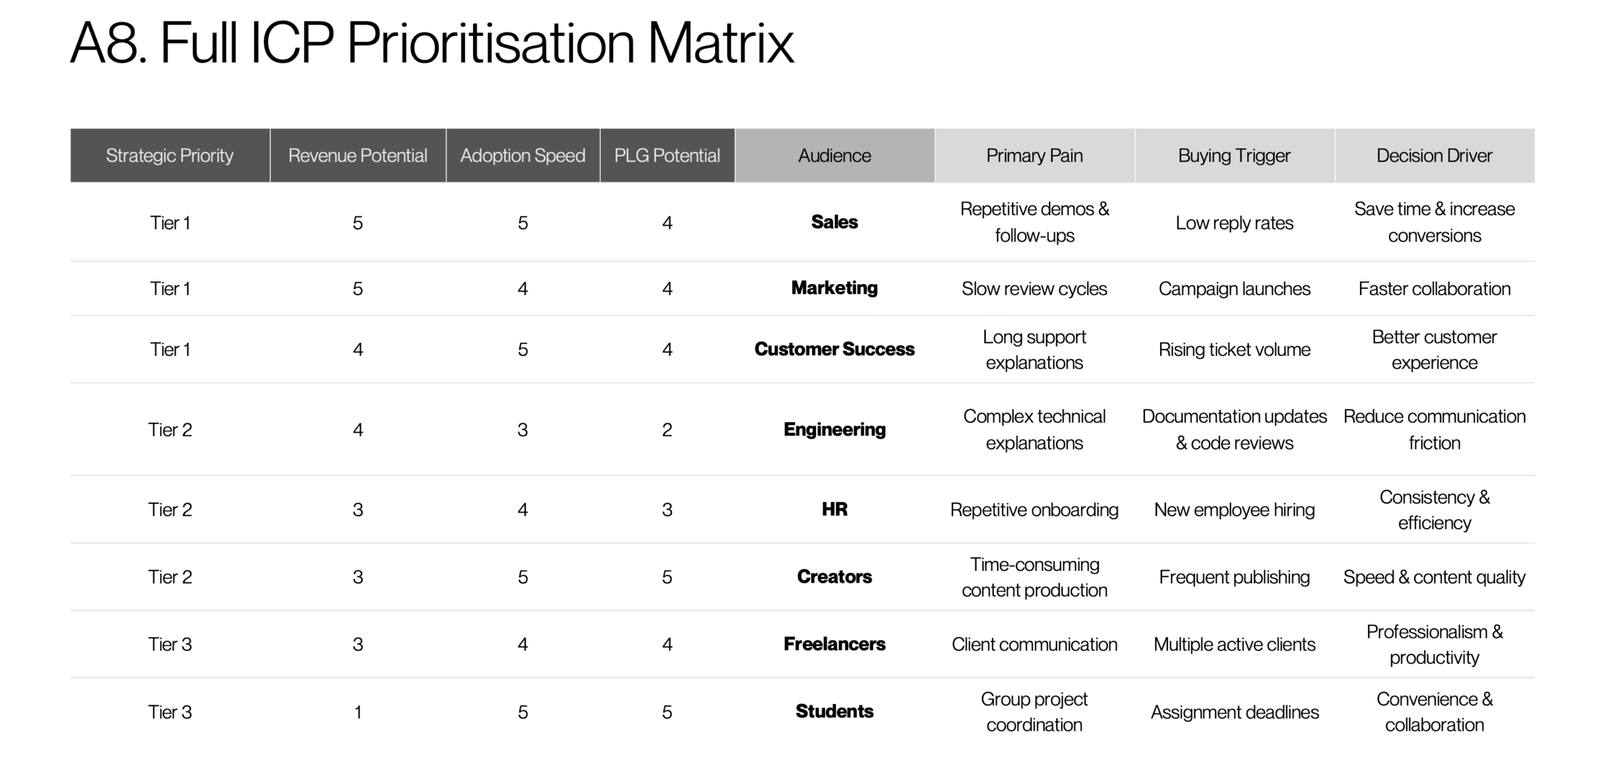
Sales · 5 / 5 / 4
Revenue potential / adoption speed / PLG potential. Test faster demos and follow-up communication.
SAAS · AUDIENCE & GO-TO-MARKET STRATEGY
A connected strategy spanning audience segmentation, competitive white space, regional timing, campaign management, and customer acquisition targets.
AUDIENCE & COMPETITORS
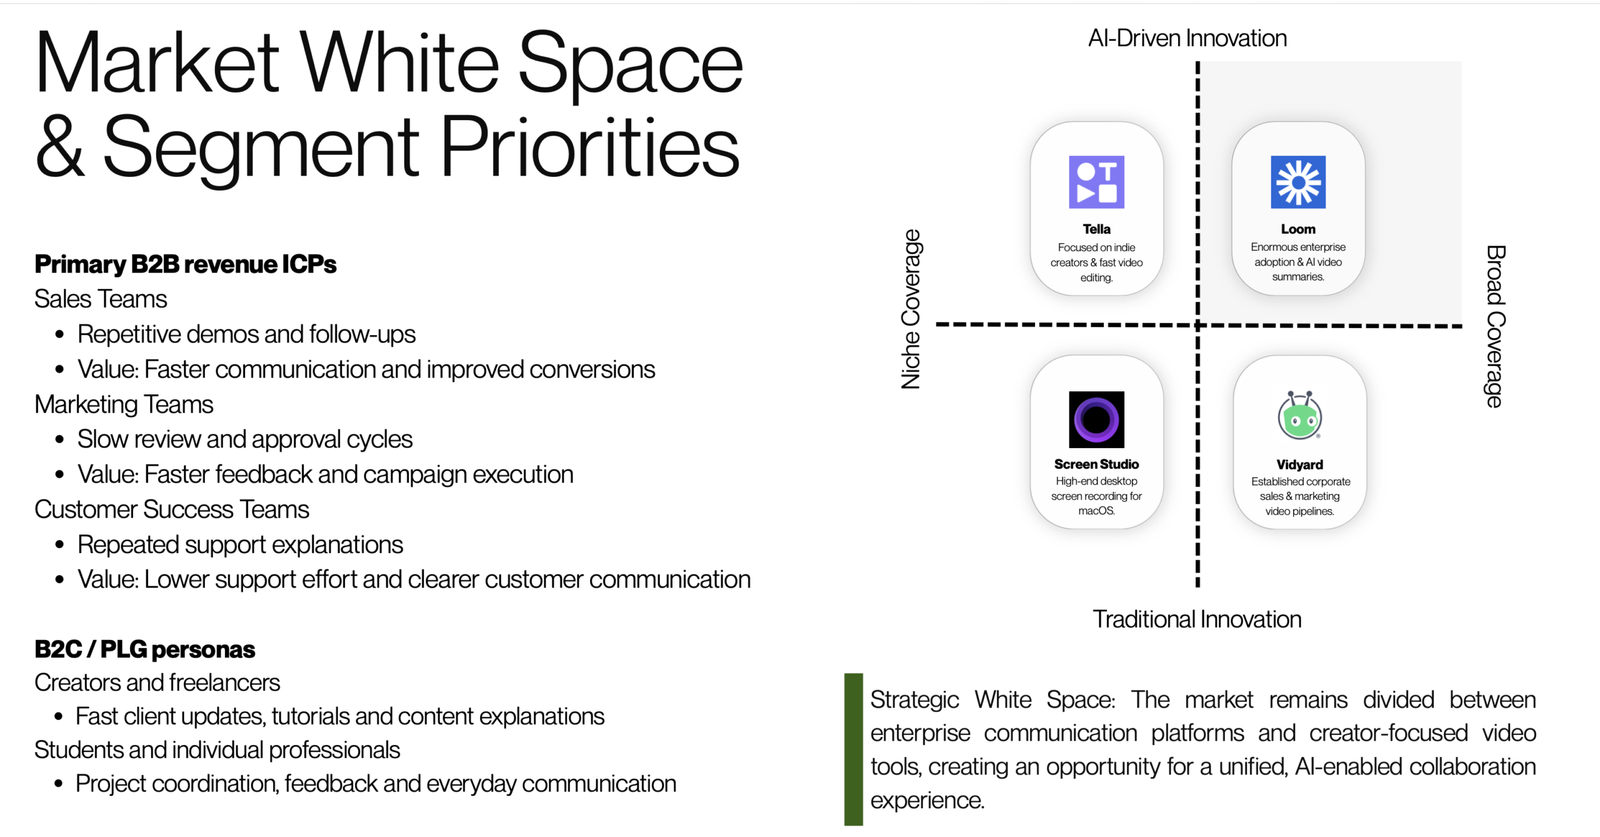
The research prioritises sales, marketing, and customer-success teams around repeated demos, slow feedback cycles, and recurring support explanations. Creators, freelancers, students, and individual professionals form additional product-led audiences.
The supplied chart positions Tella, Loom, Screen Studio, and Vidyard across coverage and innovation axes. It is a research snapshot from the deck, not a current independent product ranking. The proposed white space is a unified, AI-enabled collaboration experience; demand for that proposition still requires testing.
CUSTOMER PRIORITISATION
The matrix places Sales, Marketing, and Customer Success in Tier 1; Engineering, HR, and Creators in Tier 2; and Freelancers and Students in Tier 3. Revenue potential, adoption speed, and product-led growth potential are strategy scores rather than measured performance.
Revenue potential / adoption speed / PLG potential. Test faster demos and follow-up communication.
Test faster campaign review and collaboration workflows.
Test clearer explanations and reduced repeated support effort.
REGIONAL ROLLOUT
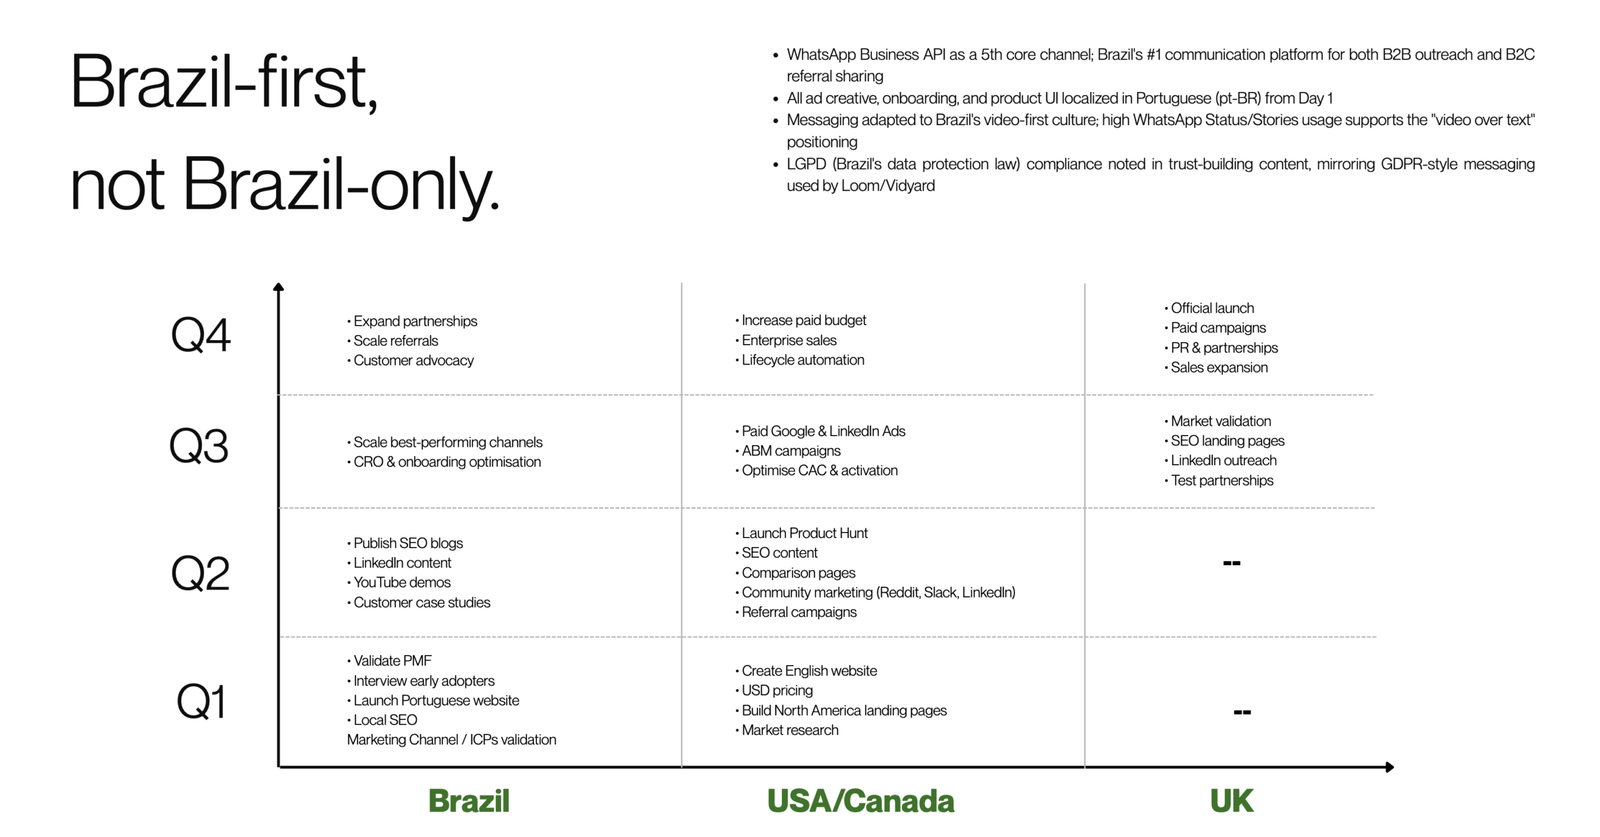
Brazil: Q1 product-market-fit and audience validation, Portuguese website and local SEO; Q2 content and demonstrations; Q3 optimisation and channel scaling; Q4 partnerships, referrals, and advocacy.
USA / Canada: Q1 English website, pricing and research; Q2 launch, content, comparison pages, and community; Q3 paid acquisition and account-based campaigns; Q4 enterprise expansion and lifecycle automation.
UK: Q3 market validation and initial channel tests, followed by a proposed Q4 launch and sales expansion. These quarters describe a planned sequence; no calendar year or completed launches are claimed.
CAMPAIGN MANAGEMENT
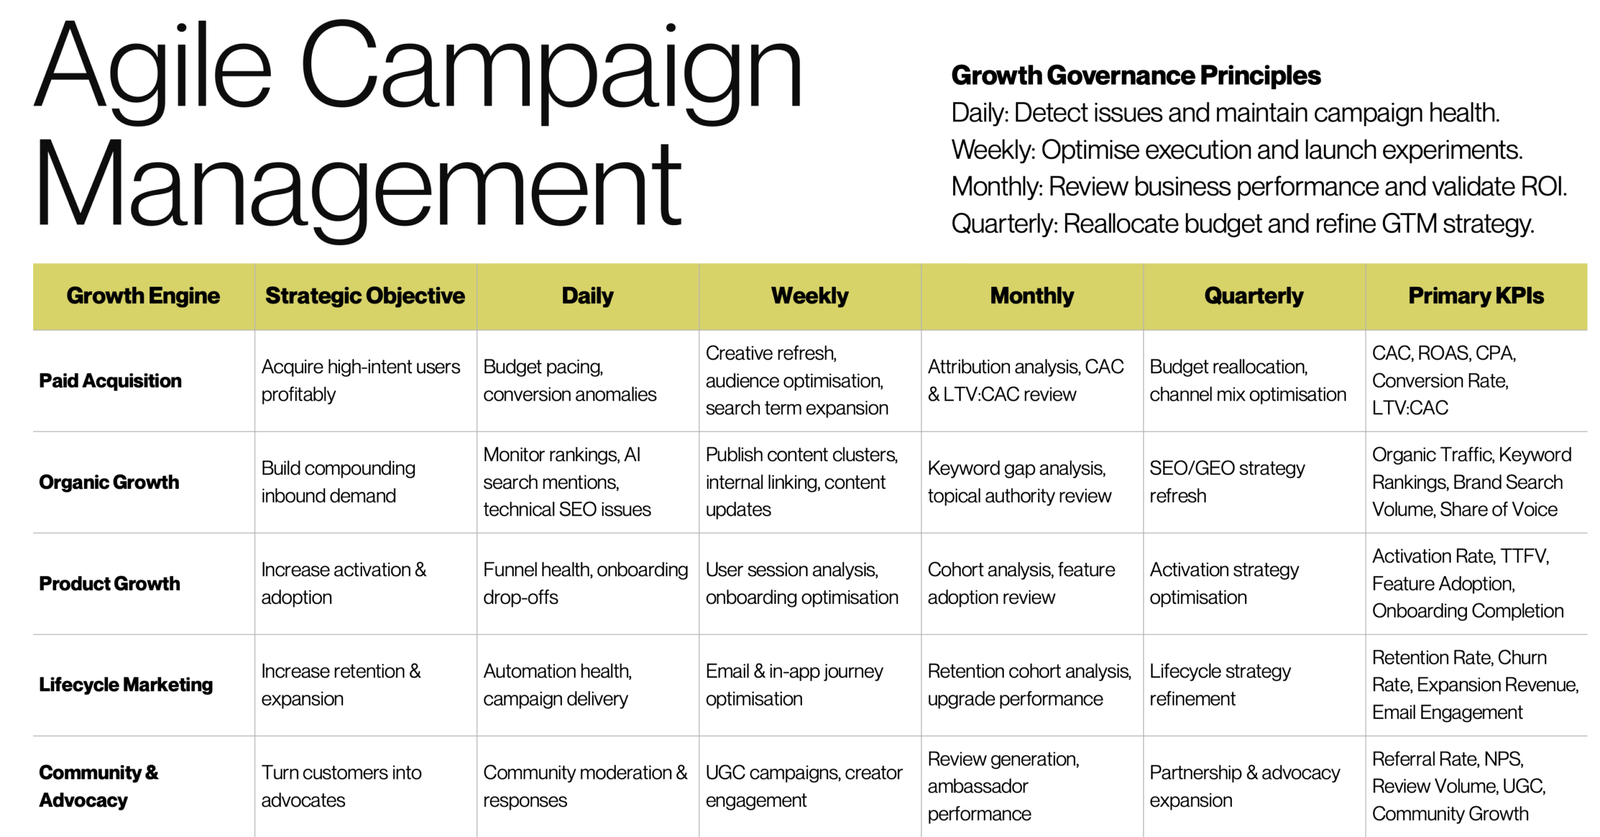
Check budget pacing, conversion anomalies, funnel health, and delivery issues.
Refresh creative, optimise audiences and content, and launch focused experiments.
Review attribution, cohorts, CAC and LTV assumptions; then revisit budget allocation and the market strategy.
The operating framework covers paid acquisition, organic demand, product activation, lifecycle marketing, and community advocacy. KPIs are monitoring requirements, not reported improvements.
CUSTOMER ECONOMICS
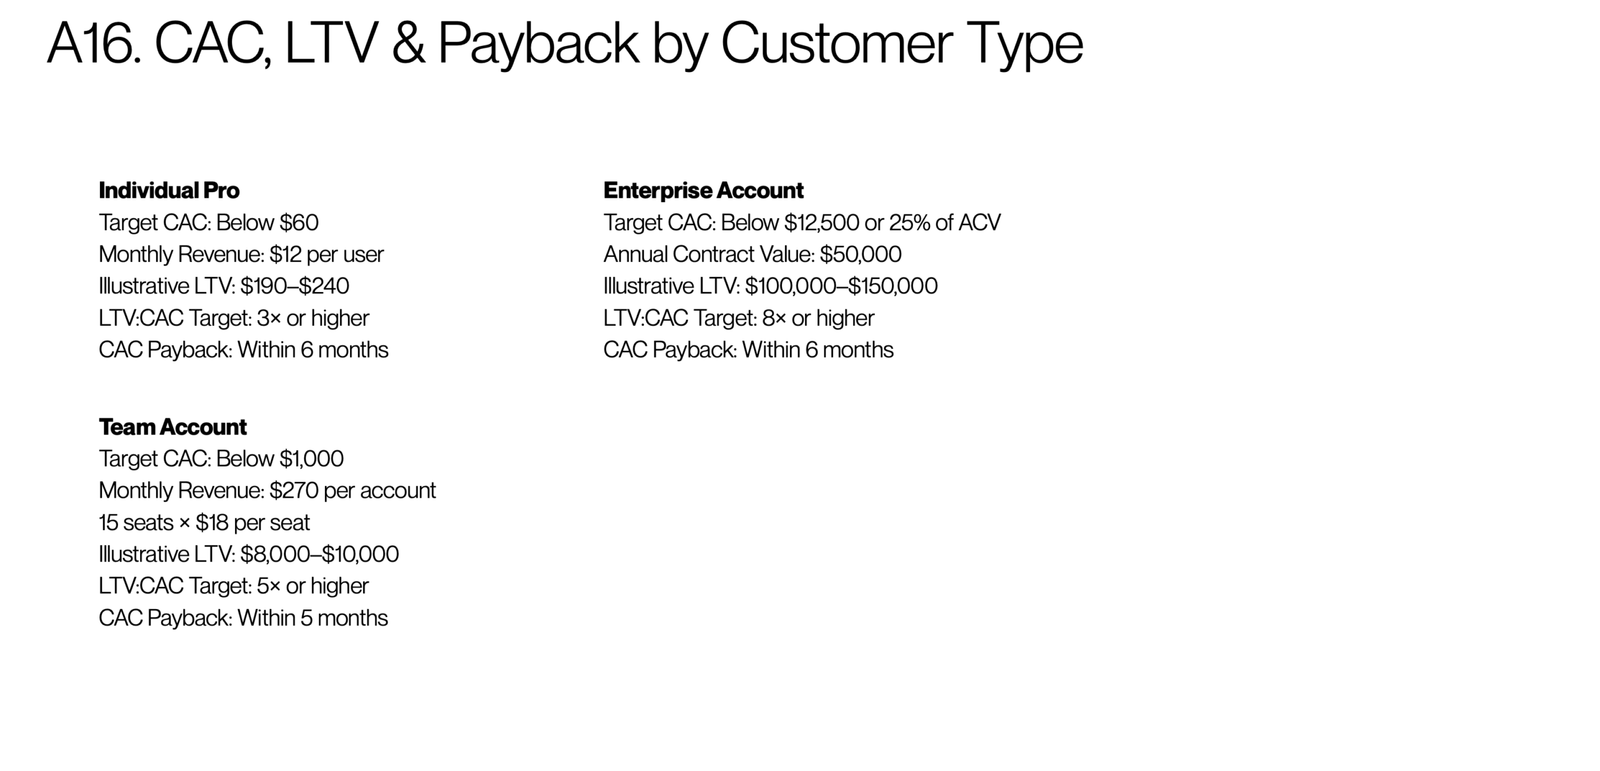
| Customer type | Target CAC | Revenue assumption | Illustrative LTV | Ratio / payback target |
|---|---|---|---|---|
| Individual Pro | Below $60 | $12 per user monthly | $190–$240 | 3×+ / within 6 months |
| Team account | Below $1,000 | $270 monthly: 15 seats × $18 | $8,000–$10,000 | 5×+ / within 5 months |
| Enterprise | Below $12,500 or 25% of ACV | $50,000 annual contract value | $100,000–$150,000 | 8×+ / within 6 months |
All figures are the deck’s illustrative assumptions or targets, not realised client results. CAC, contribution margin, retention, and billing terms must be validated before confirming payback. The ratio thresholds are minimum targets rather than exact calculations from each range.
STRATEGIC LEARNING
Use a small number of audience and market tests to validate the proposed positioning. Compare activation, qualified pipeline, customer acquisition cost, retention, and contribution before increasing spend. Keep competitor research and local requirements under review as the rollout progresses.