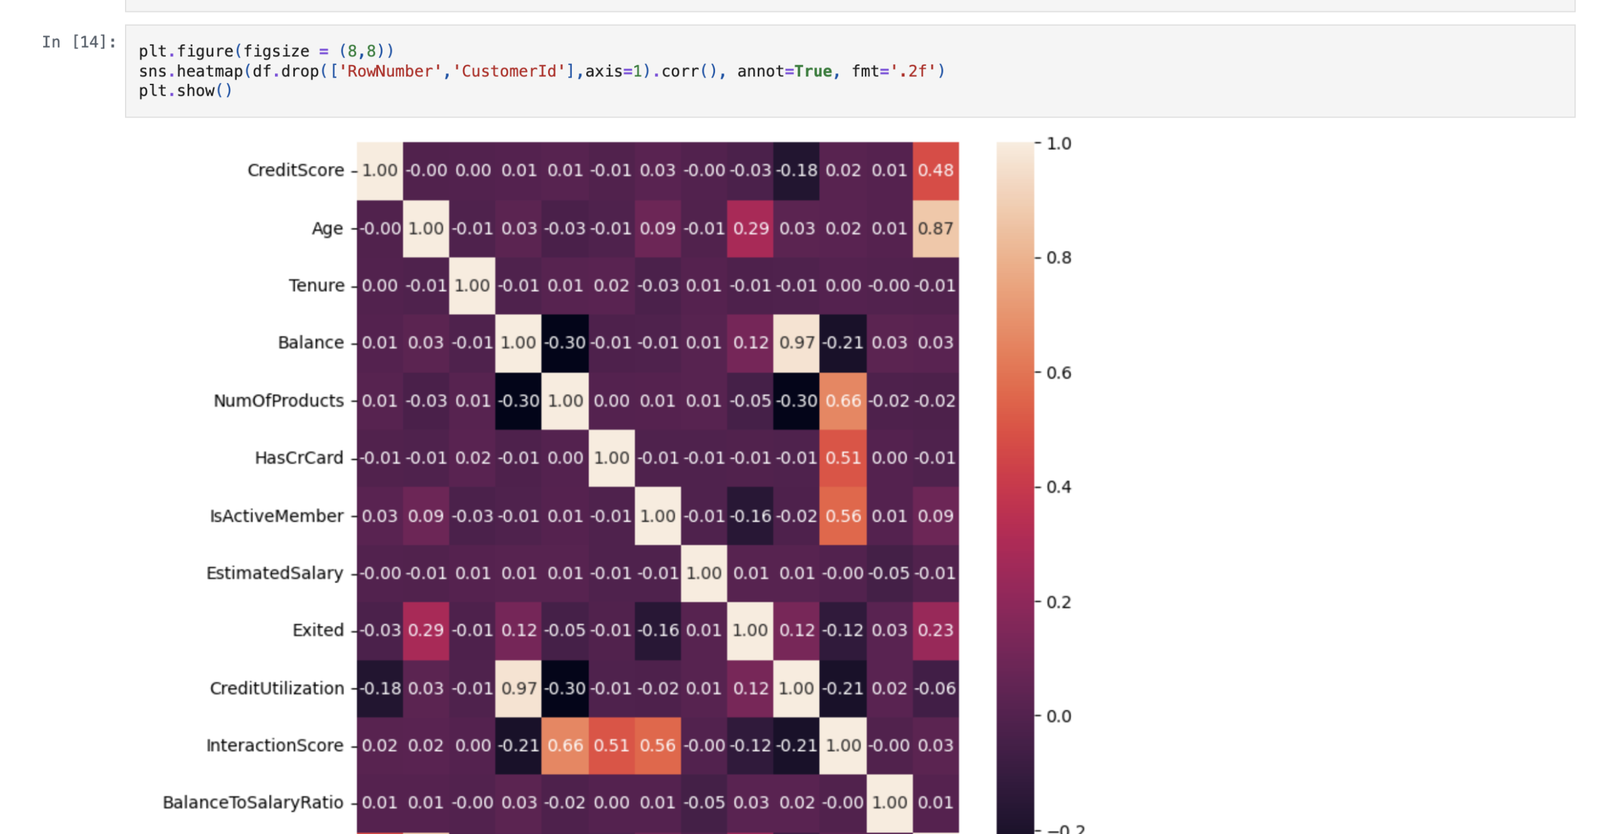
Age and exit: 0.29
The displayed positive correlation suggests a relationship worth examining by customer segment.
PYTHON · CUSTOMER ANALYTICS
Exploring customer characteristics, engagement signals, and feature relationships through Python, pandas, Seaborn, Matplotlib, and scikit-learn.
THE QUESTION
The notebook examines the relationship between the Exited target and customer attributes such as age, balance, tenure, activity, and product count. The aim is to identify useful questions for retention analysis and prepare features for further modelling.
The supplied screenshots document exploratory analysis and categorical preparation. They do not show an overall churn rate, a trained model evaluation, or an achieved retention uplift.
CORRELATION ANALYSIS
A pandas correlation matrix is visualised with an annotated Seaborn heatmap. RowNumber and CustomerId are excluded from this view so identifier fields do not distract from the feature relationships.
The displayed positive correlation suggests a relationship worth examining by customer segment.
Active membership has a negative association with the exit target in this sample.
The weaker positive relationship provides another exploratory input, not a standalone churn rule.
Balance and CreditUtilization show a correlation of 0.97. This strong overlap calls for checking how the engineered feature was defined and whether redundant variables should be handled during model development.
DATA PREPARATION
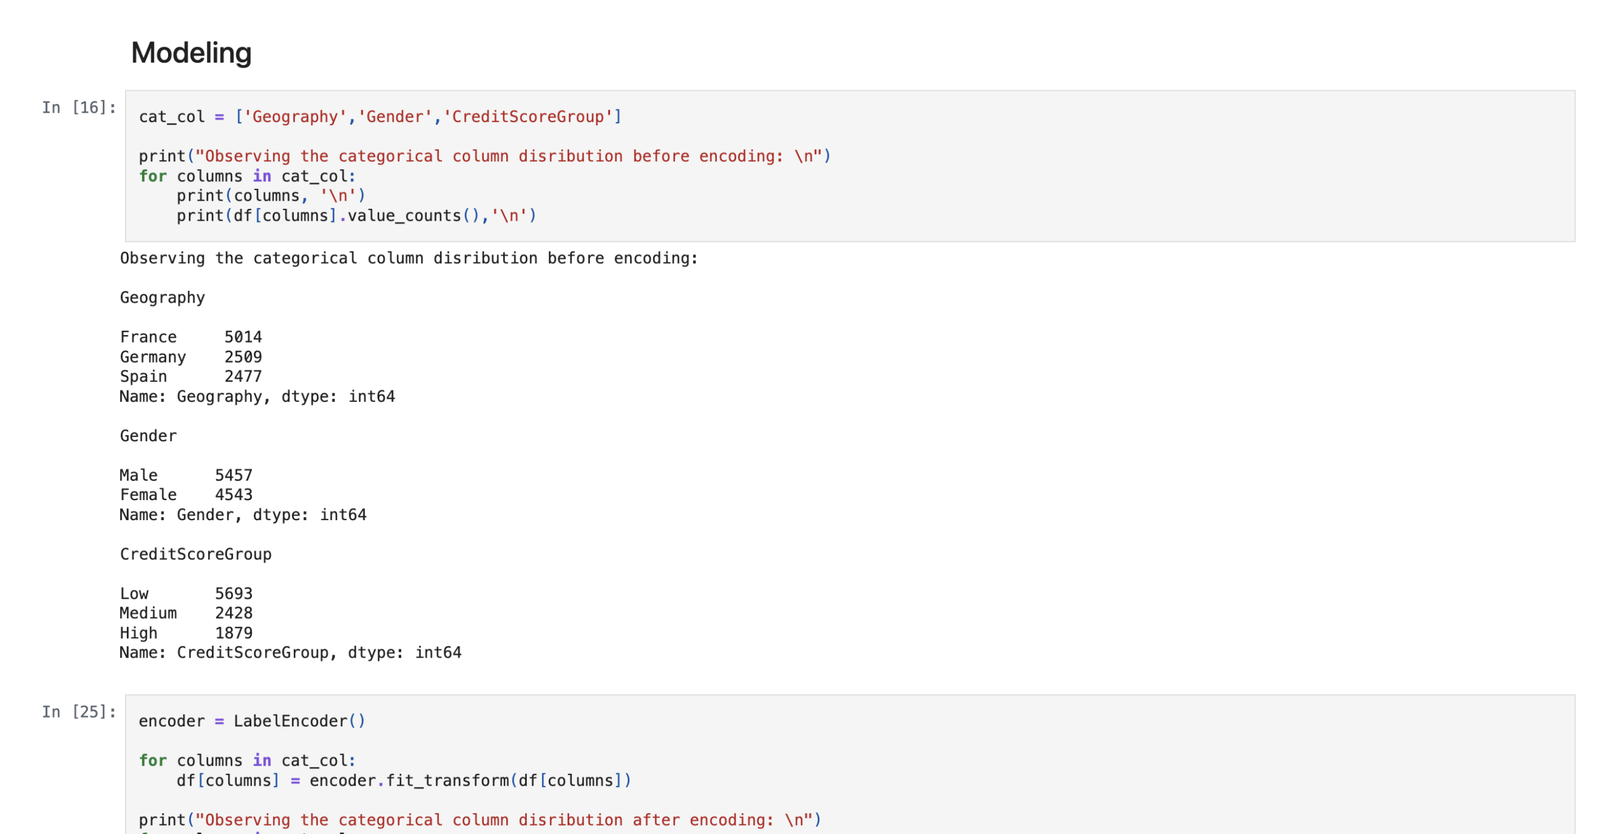
The workflow reviews Geography, Gender, and CreditScoreGroup with value_counts(), then applies LabelEncoder to the selected columns.
France: 5,014
Germany: 2,509
Spain: 2,477
Male: 5,457
Female: 4,543
Low: 5,693
Medium: 2,428
High: 1,879
LEARNING & NEXT STEPS
Calculate the Exited share from the source data before reporting an overall churn percentage.
Review encoding choices, split data before fitting transformations, and evaluate out-of-sample precision, recall, and discrimination.
Use validated findings to frame retention experiments and measure their impact on actual customer outcomes.
This project demonstrates a Python exploration and preparation workflow. It does not claim that a predictive model was deployed or that churn was reduced.